In the rapidly moving business world, project management is also changing rapidly. Hence, the success of a project is not only about completing the project. It is also about finishing the project on time and within the budget. Every Project manager knows that if the project is delayed or the project overshoots the budget, then it can derail even the best of strategies. This is why Performance measurement is so important. There are two metrics in earned value management (EVM) which are widely used; they are the Schedule Performance Index (SPI) and the Cost Performance Index (CPI).
Both of these metrics provide a reliable way to track the progress of the project and the efficiency while helping businesses to make data-driven decisions. In this blog, we will be explaining the concepts of SPI and CPI, their formulas, and the differences and also how modern Project Management Software like DoInsights simplify these calculations for real-world business success.
Understanding Performance Indices in Project Management
Before we dive deep into the ocean of knowledge, let us understand why Performance indices matter so much when calculating and determining the SPI and the CPI. Projects often have to go through phases where the actual progress differentiates from the planned schedule or budget. Therefore, to measure such deviations objectively, the project managers depend on performance indices like SPI or CPI.
- SPI is an indication towards the progress of the project, whether the project is ahead or behind schedule.
- CPI is determined or measured when the project is under or over budget.
Therefore, together these metrics also give a holistic view of the project’s health and help managers take corrective actions before issues escalate.
What is the Schedule Performance Index (SPI)?
The Schedule Performance Index (SPI) is an important metric that helps in evaluating how effectively and efficiently time has been used in a project. It is a part of the earned value management (EVM) framework and also provides insights into the progress of the project as per the schedule planned.
- Schedule Performance Index Meaning: SPI gives you information on how close your project is to the planned schedule. An SPI value of 1.0 means that the project is exactly as per the schedule.
- Why SPI Matters: Monitoring the SPI makes sure that the resources are aligned, deadlines are met, and bottlenecks are also identified.
Schedule Performance Index Formula
The schedule performance index formula is:
SPI = EV ÷ PV
Where:
- EV (Earned Value): The value of work actually completed.
- PV (Planned Value): The value of work planned to be completed by a given time.
Example of SPI in Project Management
Let’s take an example, a software development project has planned to deliver 50% of the work in the first two months, which is PV- INR 70,000. At the end of the two months, the team has only completed 50% of the work, which is EV-INR 50,000.
SPI = 50,000 ÷ 70,000 = 0.71.
This means the project is behind schedule as the SPI is less than 1.
SPI in Project Management Software
In the modern PMS tools, SPI is calculated and visualised on their dashboards. The Project managers can have an instant check through a single dashboard if the project is ahead or behind schedule, and also adjust the resource allocation accordingly.
What is the Cost Performance Index (CPI)?

The CPI is used to measure the cost efficiency of the project. It also tells you about how well the project is performing relative to the budget.
- Cost Performance Index Meaning: A CPI of 1.0 means the project is exactly on budget.
- Why CPI Matters: It helps in controlling project costs and ensuring financial sustainability.
Cost Performance Index Formula
The CPI formula in project management is:
CPI = EV ÷ AC
Where:
- EV (Earned Value): Value of work completed.
- AC (Actual Cost): Actual expenses incurred for completed work.
Example of CPI in Project Management
Using the same project example:
- EV = INR 70,000 (work completed)
- AC = INR 85,000 (actual money spent)
CPI = 70,000/85,000 = 0.82
This measurement indicates the project is over budget, since CPI is less than 1.
CPI in Project Management Software
Modern PMS tools amalgamate cost tracking with earned value management. This enables the managers to track expenses in real-time and make sure of the financial efficiency across tasks.
Performance Index Formula: SPI and CPI Together
Both of the indices are part of the performance index formula framework, which is used in project management. Therefore, together they provide a comprehensive view of the project’s health:
- SPI Formula: EV/ PV
- CPI Formula: EV/ AC
In simple terms:
- SPI shows time efficiency.
- CPI shows cost efficiency.
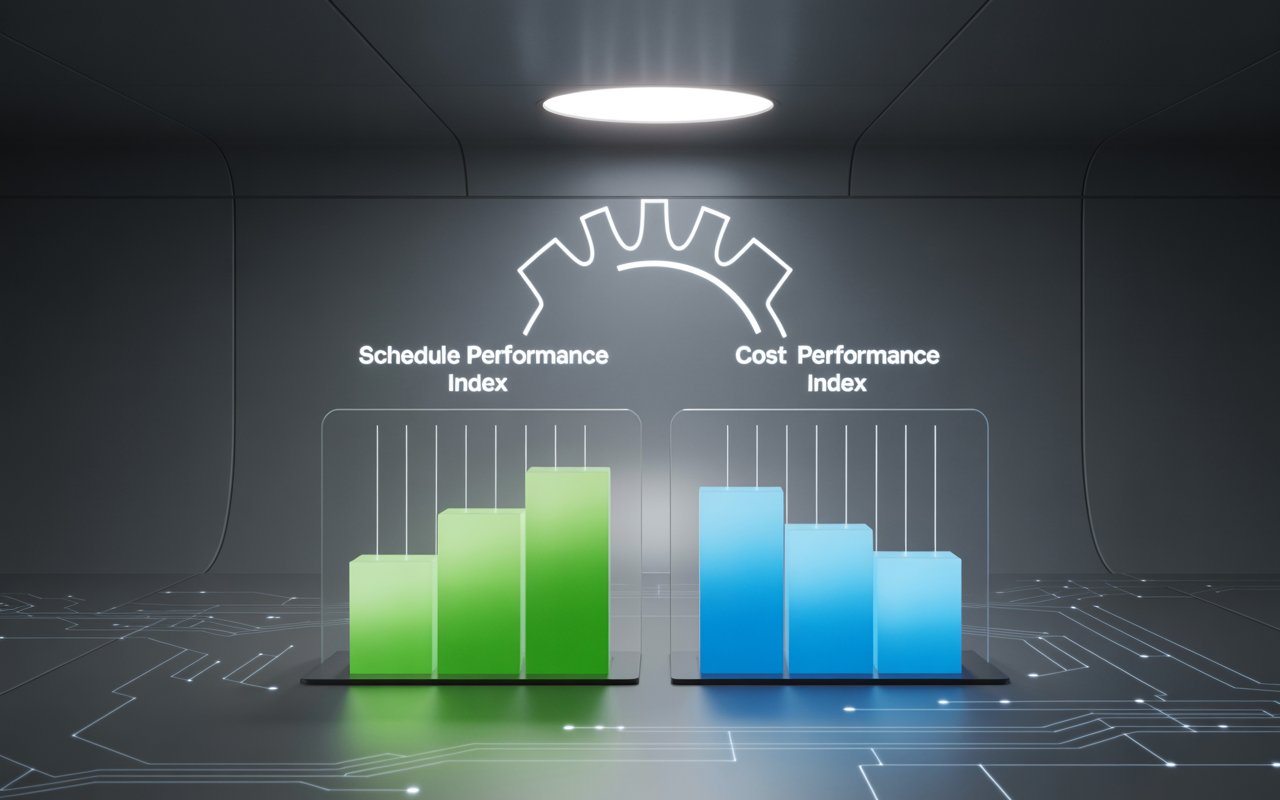
Schedule Performance Index vs. Cost Performance Index: Key Differences
Here’s how SPI vs. CPI compare:
| Factor | Schedule Performance Index (SPI) | Cost Performance Index (CPI) |
| Definition | Measures schedule efficiency | Measures cost efficiency |
| Formula | EV ÷ PV | EV ÷ AC |
| Interpretation | SPI < 1 = Behind schedule; SPI > 1 = Ahead of schedule | CPI < 1 = Over budget; CPI > 1 = Under budget |
| Focus | Time and schedule performance | Budget and financial performance |
| Application | Project planning, resource allocation | Cost control, budget tracking |
Hence, both of the metrics must be tracked simultaneously for balanced project delivery.
Significance of SPI and CPI in Project Success
- Real-Time Monitoring: It helps the project identify risks early.
- Better Decision-Making: It helps in providing an accurate data for resource allocation.
- Stakeholder Confidence: Having a transparent tracking increases trust.
- Efficient Resource Management: This also makes sure that time and money are utilised effectively.
- Supports Forecasting: It also predicts the project completion dates and final costs.
The Role of Project Management Software in Tracking SPI and CPI
Measuring the SPI and CPI physically is prone to errors. This is the reason why Project Management Software plays an important role. The modern PMS tool provides the following:
- Automating the schedule performance index formula and cost performance index formula.
- It helps in providing the dashboards with the latest SPI and CPI trends.
- Helps in sending alerts when SPI or CPI fall below critical thresholds.
- Helps the managers with an earned value analysis, ensuring managers focus on the right priorities.
Example: Using SPI and CPI Together
For understanding the concept better, let’s take an example of a construction project:
- Planned Value (PV) = INR 5,00,000
- Earned Value (EV) = INR 2,00,000
- Actual Cost (AC) = INR 2,20,000
- SPI = 2,00,000/ 5,00,000= 0.4 (behind schedule)
- CPI = 2,00,000/2,20,000 = 0.90 (over budget)
This evaluation of the project is showing that this particular construction project is struggling both on schedule and cost, showing the requirement of urgent intervention. Therefore, the modern PMS tools help the managers in pinpointing delays, reallocate resources and also optimise the spending.
Common Mistakes in Using SPI and CPI
- Relying on One Metric Alone – Making use of the SPI without CPI gives an incomplete picture to the user or the examiner.
- Incorrect Data Entry – Mistakes in recording the values of the EV, PV, or AC can lead to misleading results.
- Not Updating Regularly – The SPI and CPI must be tracked continuously.
- Ignoring Trends – A single SPi numerical value is not useful than observing the trends over time.
Conclusion
The Schedule Performance Index (SPI) and Cost Performance Index (CPI) are two of the most powerful metrics in the field of EVM project management. So while SPI tells whether the project is on schedule, CPI, on the other hand, gives indication towards the project being within the budget. When put together, these values help the organisations make an informed and data-driven decision.
Having to physically measure these indices leads to a time-consuming and error-prone procedure. That’s why a modern Project Management Software like DoInsights has become important. These tools help in automating the SPI formula, CPI formula and overall performance index framework. DoInsights help in making sure that there is accuracy, efficiency and real-time project visibility.
Therefore, businesses in India that are aiming to manage their PMS efficiently and effectively are looking for a PMS tool that will help them enhance their businesses. For them, DoInsights is the answer to their question. DoInsights is the PMS tool that helps in managing the project, its progress and also helps the managers in checking whether the project is on budget or not.
So if you are someone who is one amongst them, then contact DoInsights today and book your 14-day free trial today!